Publishing digital elevation in Cesium
Digital elevation data is now readily available from multiple sources. There are several tools that can help to visualise elevation data, Cesium being one. Recently I have been researching how to visualise terrain data in cesium and I could not see a complete example that I could replicate on my own. This post will highlight the steps I took to visualise elevation data in cesium.
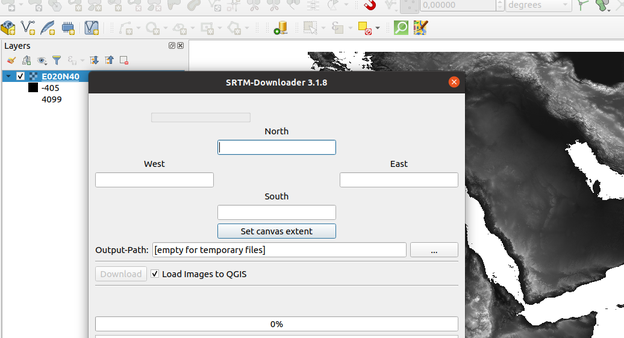
- Download elevation data. You can download the data from https://dwtkns.com/srtm30m/ or using the SRTM Downloader plugin in QGIS. In this example, I am using a GeoTIFF from https://github.com/kartoza/docker-mapproxy/blob/master/data/E020N40.tif

- Modify your downloaded images to create a seamless layer. You can use gdalbuildvrt or merge the individual tiles to a single image using gdal_merge.py.
- Spin up an instance of GeoServer. In this case, we will use the kartoza/geoserver docker image. To render the terrain data, we also need to install a GeoServer BIL extension. We run the following command to spin up GeoServer with the correct extension.
docker run -d -p 8080:8080 --name geoserver -v `pwd`/data:/data -e COMMUNITY_EXTENSIONS=dds-plugin kartoza/geoserver:2.17.2 - Open your GeoServer instance and publish your DEM.
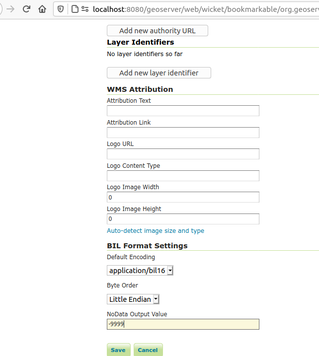
NB: Remember to define the BIL format settings for your raster layer when publishing the layer.
- Navigate to layer preview and test if you can preview your raster layer.
- Proceed to download the cesium terrain workshop material https://github.com/CesiumGS/cesium-workshop
NB: The cesium workshop shows a lot of information which is not necessary for our example. We need to modify index.html and Source/App.js to be minimalistic for our example. - Delete some lines from the index.html by running:
sed -i.bak '24,54d;' cesium-workshop/index.html - Add a minimalistic App.js to replace the current one in the folder cesium-workshop/Source.
(function () {
    "use strict";
    var west = 7.1;
    var south = -11.2;
    var east = 72.9;
    var north = 41.2;

    var rectangle = Cesium.Rectangle.fromDegrees(west, south, east, north);

    Cesium.Camera.DEFAULT_VIEW_FACTOR = 0;

    Cesium.Camera.DEFAULT_VIEW_RECTANGLE = rectangle;
    var viewer = new Cesium.Viewer('cesiumContainer', {
        scene3DOnly: true,
        selectionIndicator: false,
        baseLayerPicker: false

    });

    // Remove default base layer
    viewer.imageryLayers.remove(viewer.imageryLayers.get(0));
    viewer.imageryLayers.addImageryProvider(new Cesium.IonImageryProvider({assetId: 3954}));
    var terrainProvider = new Cesium.GeoserverTerrainProvider({
        url: "http://localhost:8080/geoserver/wms",
        layerName: "kartoza:E020N40",
        //styleName: "tradecraft:graytocolor",
        waterMask: true
    });
    viewer.terrainProvider = terrainProvider;
}()); - Add a declaration for using Cesium-GeoserverTerrainProvider.
sed -i '/App.js/i <script src="Source/GeoserverTerrainProvider.js"></script>' cesium-workshop/index.html - Use a web server to render your HTML file. For my use case, I am using Nginx in docker.
Where my nginx conf located in sites-enabled looks likeversion: '3.4'
services:
ngnix:
image: nginx
volumes:
- ./cesium-workshop:/web
- ./sites-enabled:/etc/nginx/conf.d:ro
logging:
driver: json-file
options:
max-size: 200m
max-file: '10'
ports:
- 8091:80
server {

    listen      80;
    # the domain name it will serve for
    server_name localhost;


    # max upload size, adjust to taste
    client_max_body_size 15M;

    location / {
        add_header "Access-Control-Allow-Origin" "*";
        add_header 'Access-Control-Allow-Methods' 'GET, POST, OPTIONS, PUT, DELETE';
        add_header 'Access-Control-Allow-Headers' 'X-Requested-With,Accept,Content-Type, Origin';
        root /web/;
        index index.html index.htm;
    }

    error_page 500 502 503 504 /50x.html;
    location = /50x.html {
        root /usr/share/nginx/html;
    }

} - Navigate to http://localhost:8091
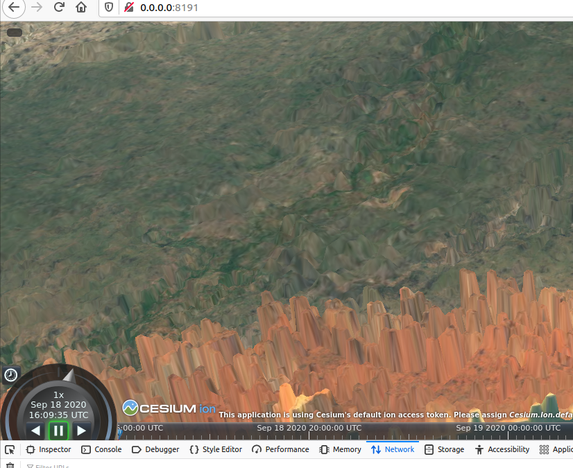
- Rotate your map and you should be able to visualise the terrain as depicted below.

- In the production environment remember to replace the cesium default ion access token with your own
 Kartoza
Comments
There are currently no comments
New Comment